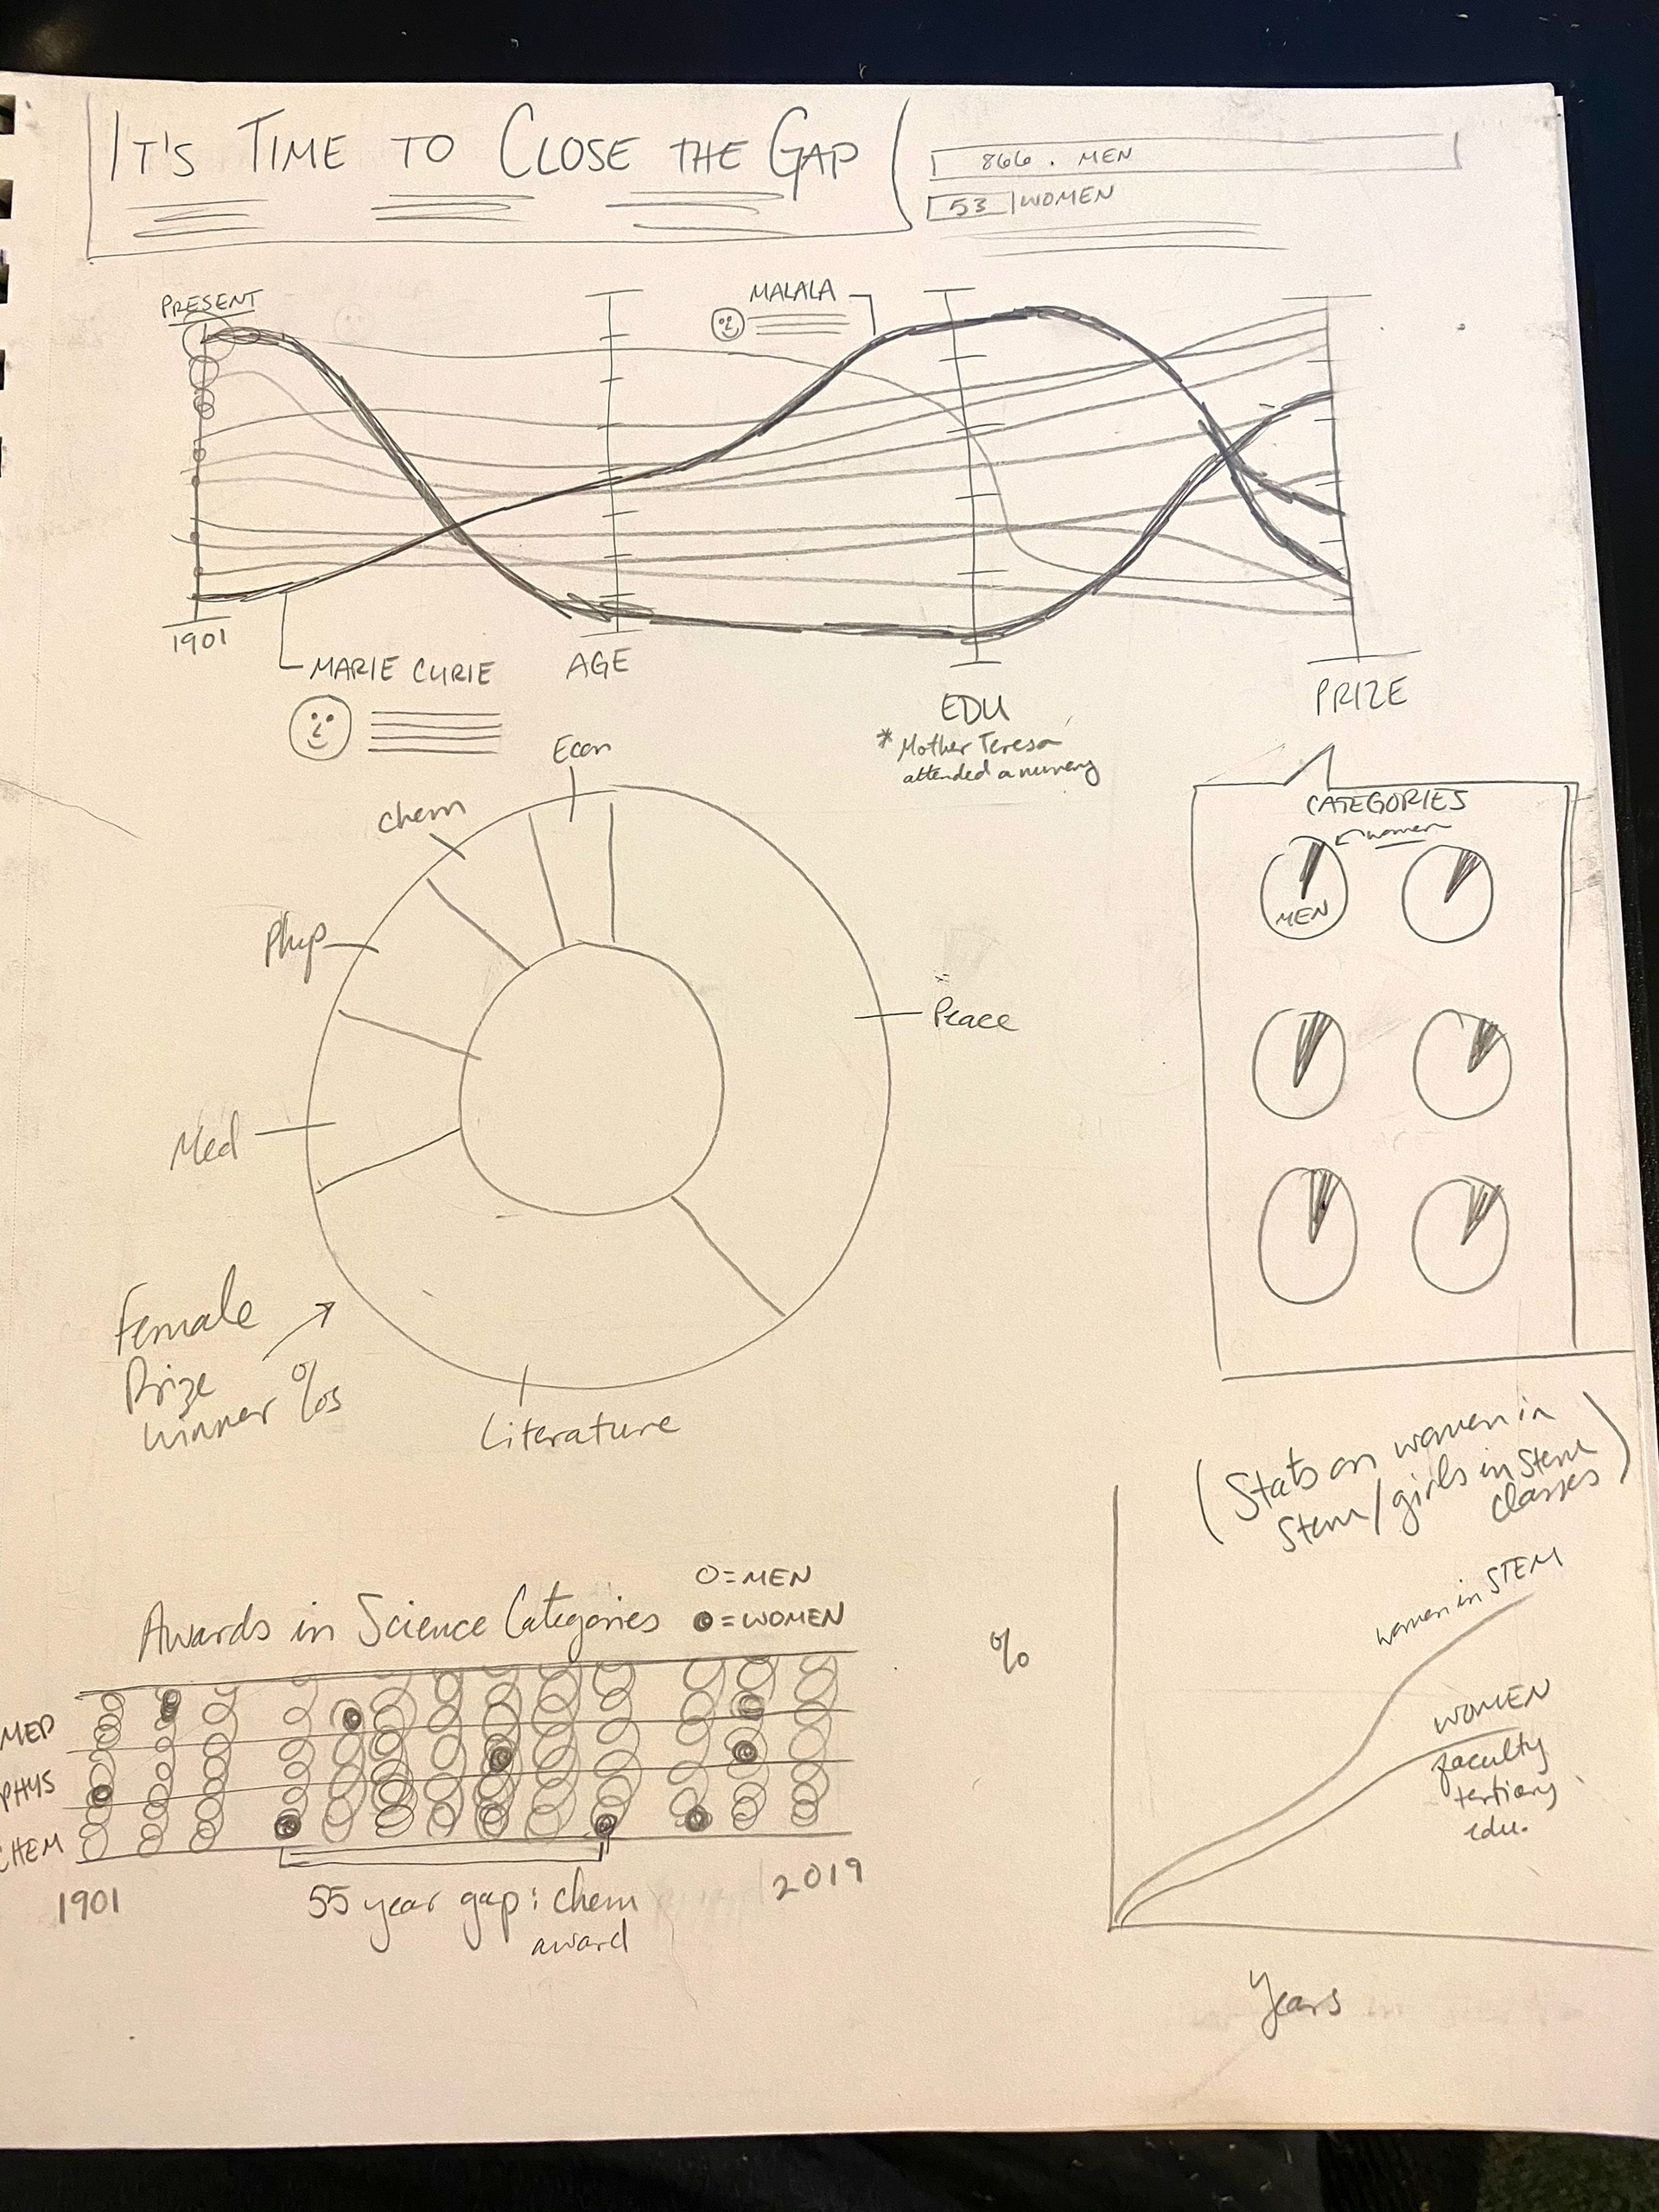
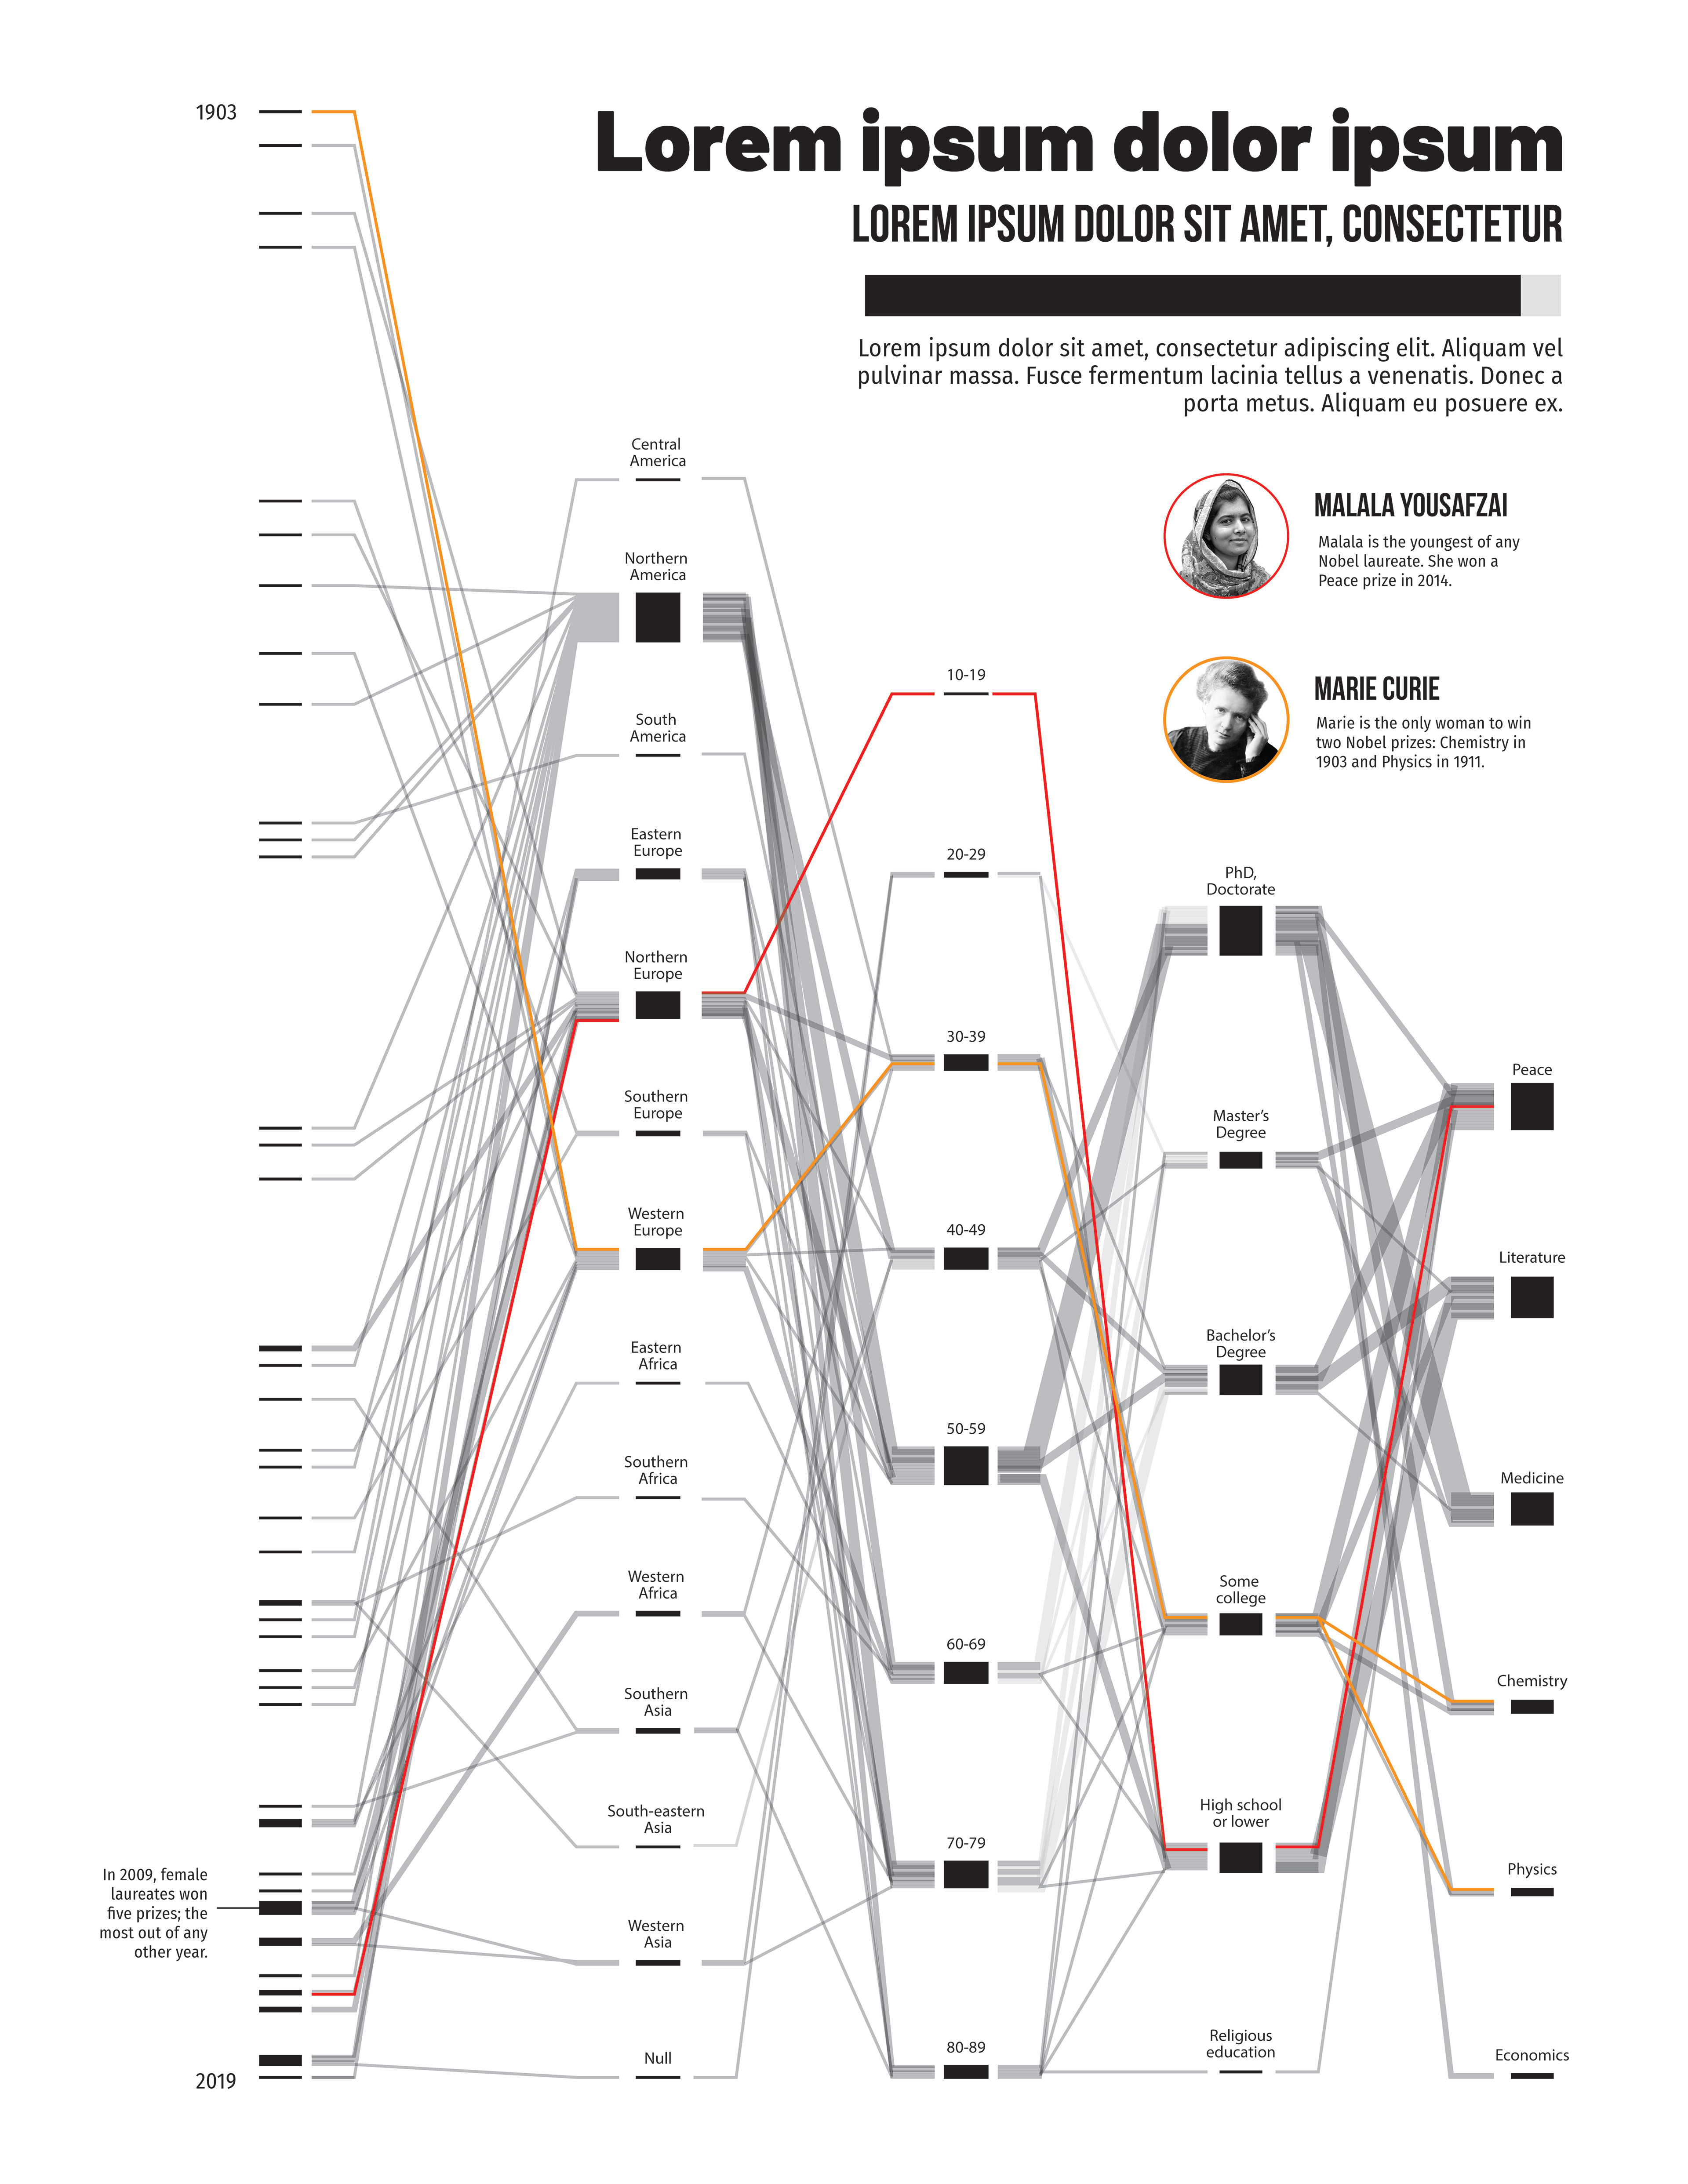
Concept: As an assignment for my graduate-level infographics class, I was required to design a graphic on any topic involving the Nobel Prize, as the 2020 laureates were to be announced during the duration of this project. I chose to focus on the history of the women who have won the prize, as well as the women who won in 2020, because of the great gender gap between laureates. During my planning phase, I decided that a Sankey diagram would be the perfect way to show readers the connections between certain attributes of the winners' situation in life at the time they won a prize.
Work: My role in this project was to decide on a focus, research that focus, cultivate data, write all of the text, layout the page and design the infographic itself.
Challenges: I had never created a Sankey diagram before this project, so making one as complex as this accurate and readable was a great challenge for me.
Program: Adobe Illustrator
Timeline: 4 weeks
Process

My first sketch


